Processing Marine Cadastre AIS Data for TrAISformer
September 8, 2026Updated September 11, 2026:
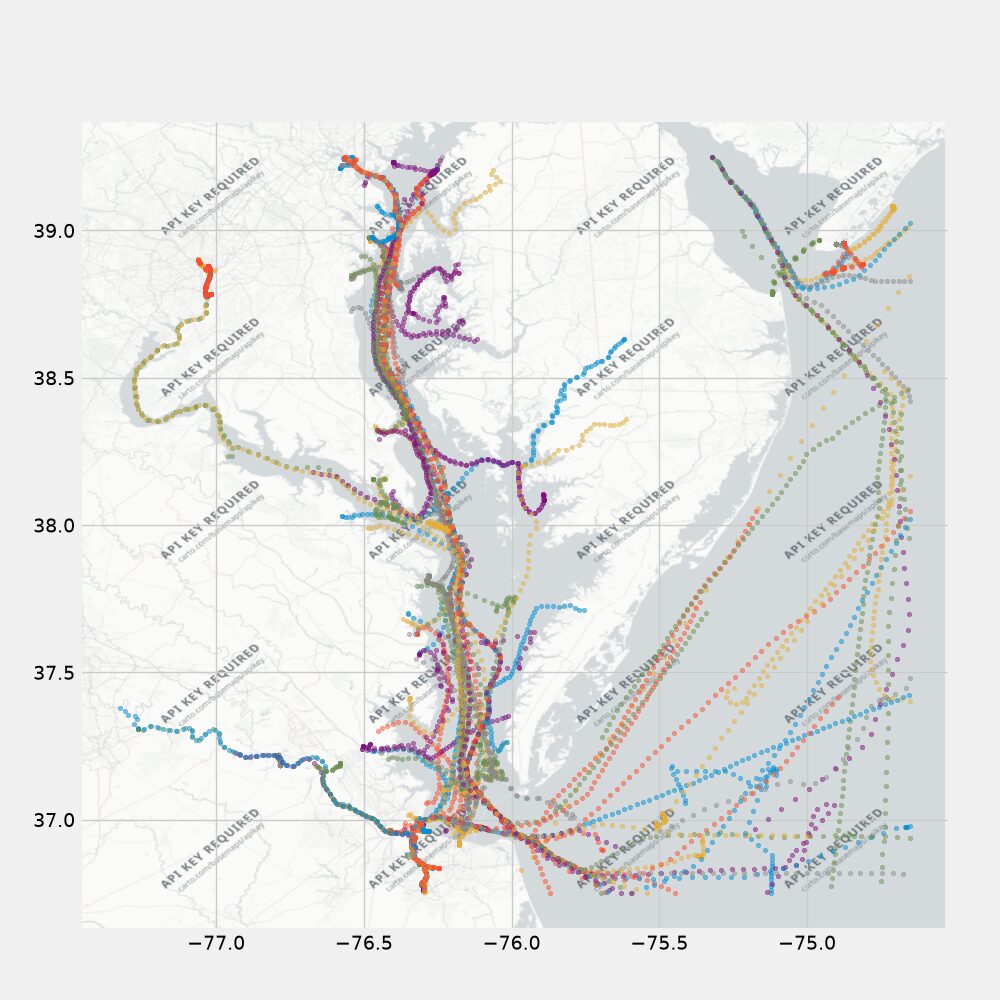
create_tracks.pynow splits each vessel’s day into contiguous voyage segments before resampling and rejects any track that spans too much distance over land, removing tracks that previously appeared to sail straight over land — see “Create Tracks” below.
The Marine Cadastre publishes a year of Automatic Identification System (AIS) broadcast messages from every vessel required to carry a transponder — position, speed, and heading, reported every few seconds. This repo processes the 2023 data into the format used by TrAISformer, a transformer model for vessel trajectory prediction. I have a fork of TrAISformer where I train it on this data.
After the pipeline below runs, each record is [lat, lon, sog, cog, unix_timestamp, mmsi] —
latitude, longitude, speed over ground, course over ground, a timestamp, and the vessel’s MMSI
identifier. This is the format used in the TrAISformer paper, so the processed data can be fed
directly into the model. The default output location is ./output/mc_ais, as pickle files.
All of the code discussed below lives in the coast_guard_AIS_data repository on GitHub.
Data Processing Pipeline
Running the Whole Pipeline
scripts/process_all_data.sh runs the processing stages end to end, with a progress bar per
stage. It never touches zips or unzips, and asks before emptying any directory.
./scripts/process_all_data.sh            # rebuild tracks + splits
./scripts/process_all_data.sh --full     # also rebuild filtered + rois (re-reads ~303 GB)
./scripts/process_all_data.sh --plots    # also render the per-day PNGs
The default is tracks-only, which is all a change to the track-building code needs; use
--full only when the row-level filters in filter_invalid_data.py have changed, since rois
derives from filtered and the two must stay in sync. The stages can also be run one at a
time, as below — every stage skips files whose output already exists, so an interrupted run
resumes rather than starting over.
Getting the Data
Edit the paths in scripts/get_all_2023_broadcast_data.sh to download all the data (you might
need to make the script executable with chmod +x). The 365 days of 2023 data is about 111GB
of compressed csv files; I downloaded it into a directory called zips.
Unzipping the Data
Unzip everything and move it into another directory:
ls zips/ | xargs -I {} unzip zips/{} -d unzips/
The unzipped data is about 303GB.
Future work: convert the data to parquet format to save on space.
Filter Out Invalid Data
python ./filter_invalid_data.py
This removes bad data — unrealistic speeds (see max_sog_kts in config.py), MMSIs that
aren’t 9 digits, MMSIs that belong to aircraft, negative headings, and so on. Rows that pass
validation are written to another csv file. Roughly 80-82% of the data is valid. Update the
paths in the script for your system.
Select Region-of-Interest Data
The TrAISformer paper trained on a region of interest about 2.5 x 2.7 degrees in lat x lon;
the same size is the default in configs.py. Unlike the paper, though, the default region
here is centered on Washington, DC / Chesapeake Bay.
python ./select_roi_data.py
About 4-7% of the data falls within the default Washington DC / Chesapeake Bay region.
Create Tracks
Build vessel tracks from the broadcast messages:
./create_tracks.py
Optionally, plot the tracks afterward with ./plot_tracks.py.
A day of AIS broadcasts for one MMSI is not one track. The region-of-interest stage drops
every message outside the box, so a vessel that leaves the region and comes back leaves a
multi-hour hole in its day — resampling across that hole invents a straight line, which is how
earlier plots had ships sailing over the Delmarva peninsula. create_tracks.py first cuts each
vessel’s day into contiguous voyage segments, splitting wherever:
- the time gap exceeds
max_gap_sec(30 min) — the region-exit case above, - the implied point-to-point speed exceeds
max_jump_kts(40 kt) — MMSI collisions and spoofed positions, which teleport even without a time gap, - the vessel idles below
idle_sog_kts(0.5 kt) for longer thanmax_idle_sec(1 h) — the dwell itself is discarded, so moorings don’t swamp the actual voyages.
Each segment is then resampled onto a uniform 600 s grid (course over ground is interpolated on
the unit circle, so a 350° → 10° turn goes through north rather than backwards
through south), checked against a land mask, and cut into chunks of at most
max_resampled_points (144 samples = 24 h). Chunks shorter than min_resampled_points (36,
matching TrAISformer’s own min_seqlen) are dropped — output tracks are therefore 36-144
samples with every consecutive step exactly 600 s, matching the shape of the paper’s ct_dma
reference data.
The land mask is a backstop behind segmentation rather than the primary defense — on a 7-day
trial it rejected nothing that segmentation hadn’t already removed. It’s applied to the
resampled track, never the raw points: at the ~1 km resolution of the grid, 56% of genuine
receptions read as “land” because moored vessels sit at piers in Norfolk and Baltimore. A track
is rejected only when it spans more than land_run_nmi overland in a straight line — span
rather than distance traveled, because a vessel working a waterway too narrow for the grid to
resolve otherwise accumulates land distance without bound: the Potomac water taxis at
Washington, DC clock up 50 nmi doing laps in a river under 1 km wide.
Split Data
python ./split_tracks.py
Splits the tracks into train, eval, and test sets, ready for TrAISformer. The split is at day
granularity — whole days are shuffled and assigned to train/valid/test, so a single vessel’s day
never straddles two splits. The shuffle is seeded (Splits.seed in config.py) and filenames
are sorted first, so the same day always lands in the same split and two training runs are
comparable; changing the seed reshuffles every day and invalidates any comparison against a
previously trained model.
The full source — the download script, the filtering and region-of-interest steps, track construction, and the train/eval/test split — is on GitHub at dennisfgardner/coast_guard_AIS_data.
Source code: https://github.com/dennisfgardner/coast_guard_AIS_data